Getting Started
Once your server has been installed and is running, you will receive your own provisioned URLs for both Grafana and Loki.
Start by opening your Grafana URL. By default, the login is admin | admin, and you will be prompted to change your password right away.
It goes without saying, but please actually do so. Change your password 🙏
Once that is done, you will have full control over your own Grafana instance. Everything is already installed to get you started, so you can begin exploring dashboards, data sources, and log queries immediately.
Setting up ox_lib
Inside the logging page, you will find your Loki credentials. There is also a convenient Show CFG button that gives you ready-to-use configuration lines for the ox_lib logger setup.
If you ever rotate the password, make sure to update your server.cfg afterwards.

Adding your first dashboard
Grafana dashboards are extremely powerful, but they are also fairly easy to work with once you understand the basics. You can read more about them in the Grafana dashboard documentation.
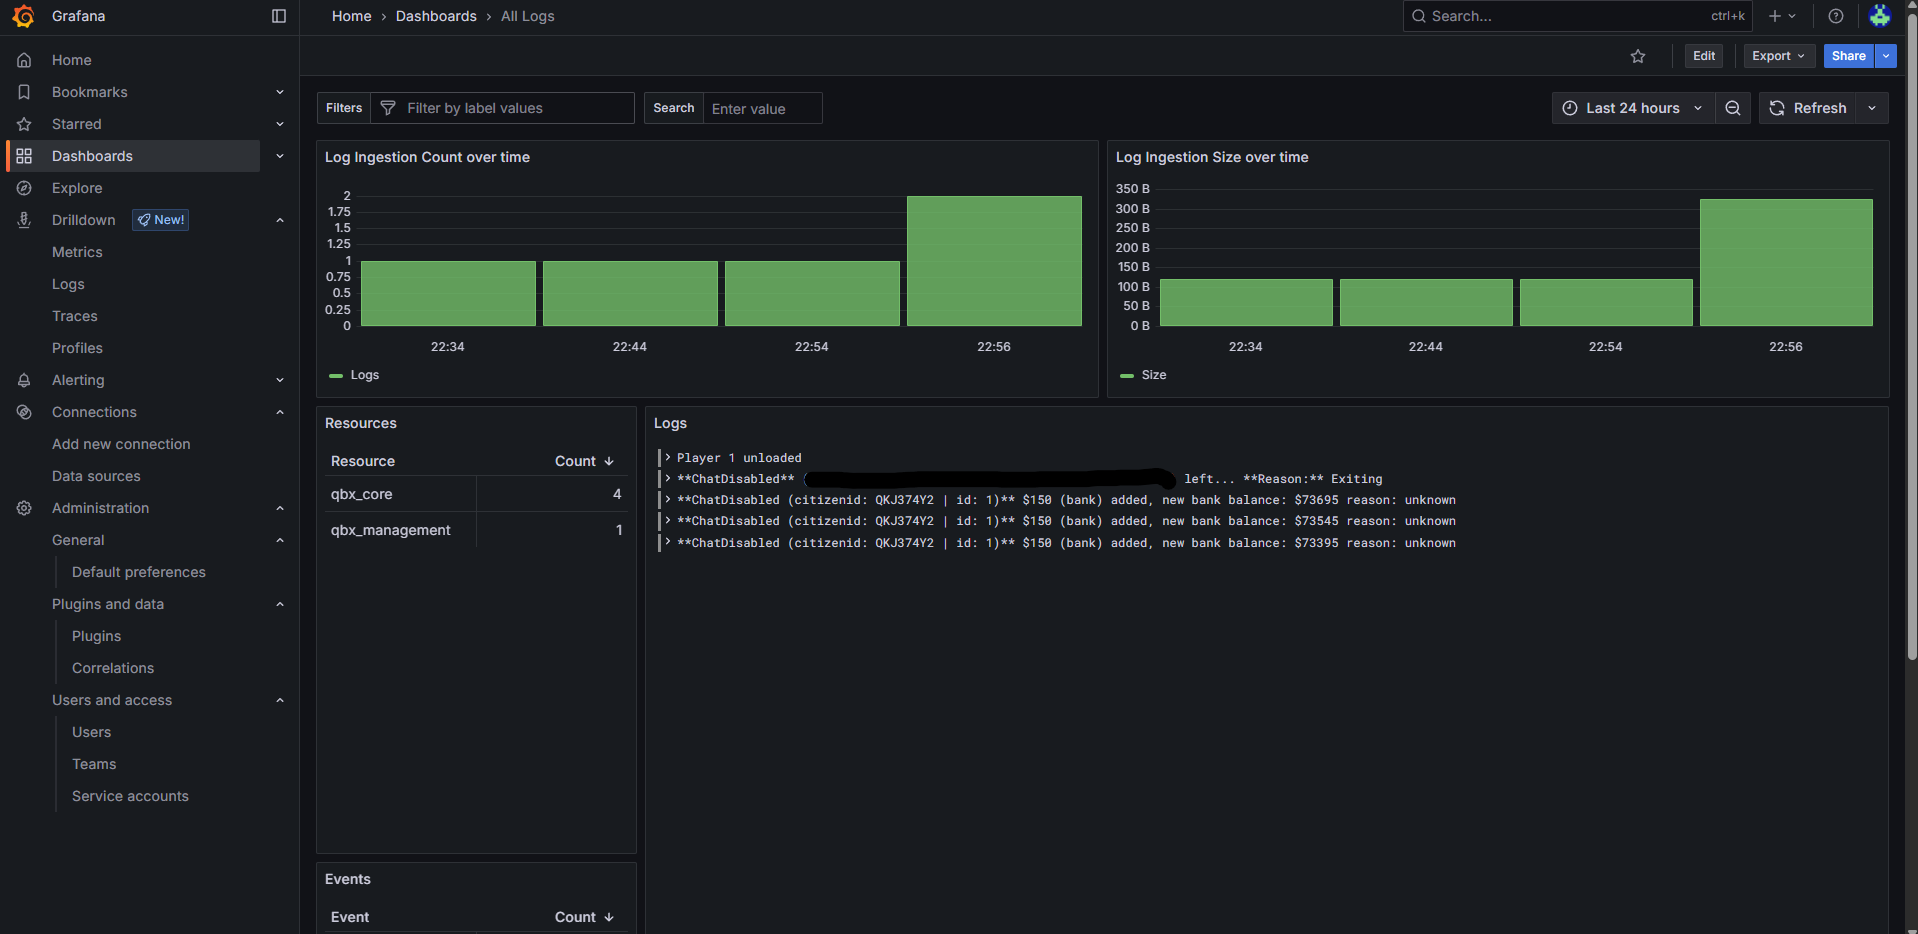
To make things easier, there are already premade dashboards built specifically for FiveM. In this example, we will use this dashboard, which visualizes all incoming logs from your server.
Copy the full JSON file, then open your Grafana instance and go to the Dashboards section. When creating a new dashboard, choose the Import option.

Paste in the JSON you copied from GitHub, press Load, then select the preconfigured Loki instance as the data source. Once that is done, your first dashboard is ready to use.

If you ever need more dashboard examples feel free to look at our Geomap or our database examples