🗃️ Logging
ㅤ
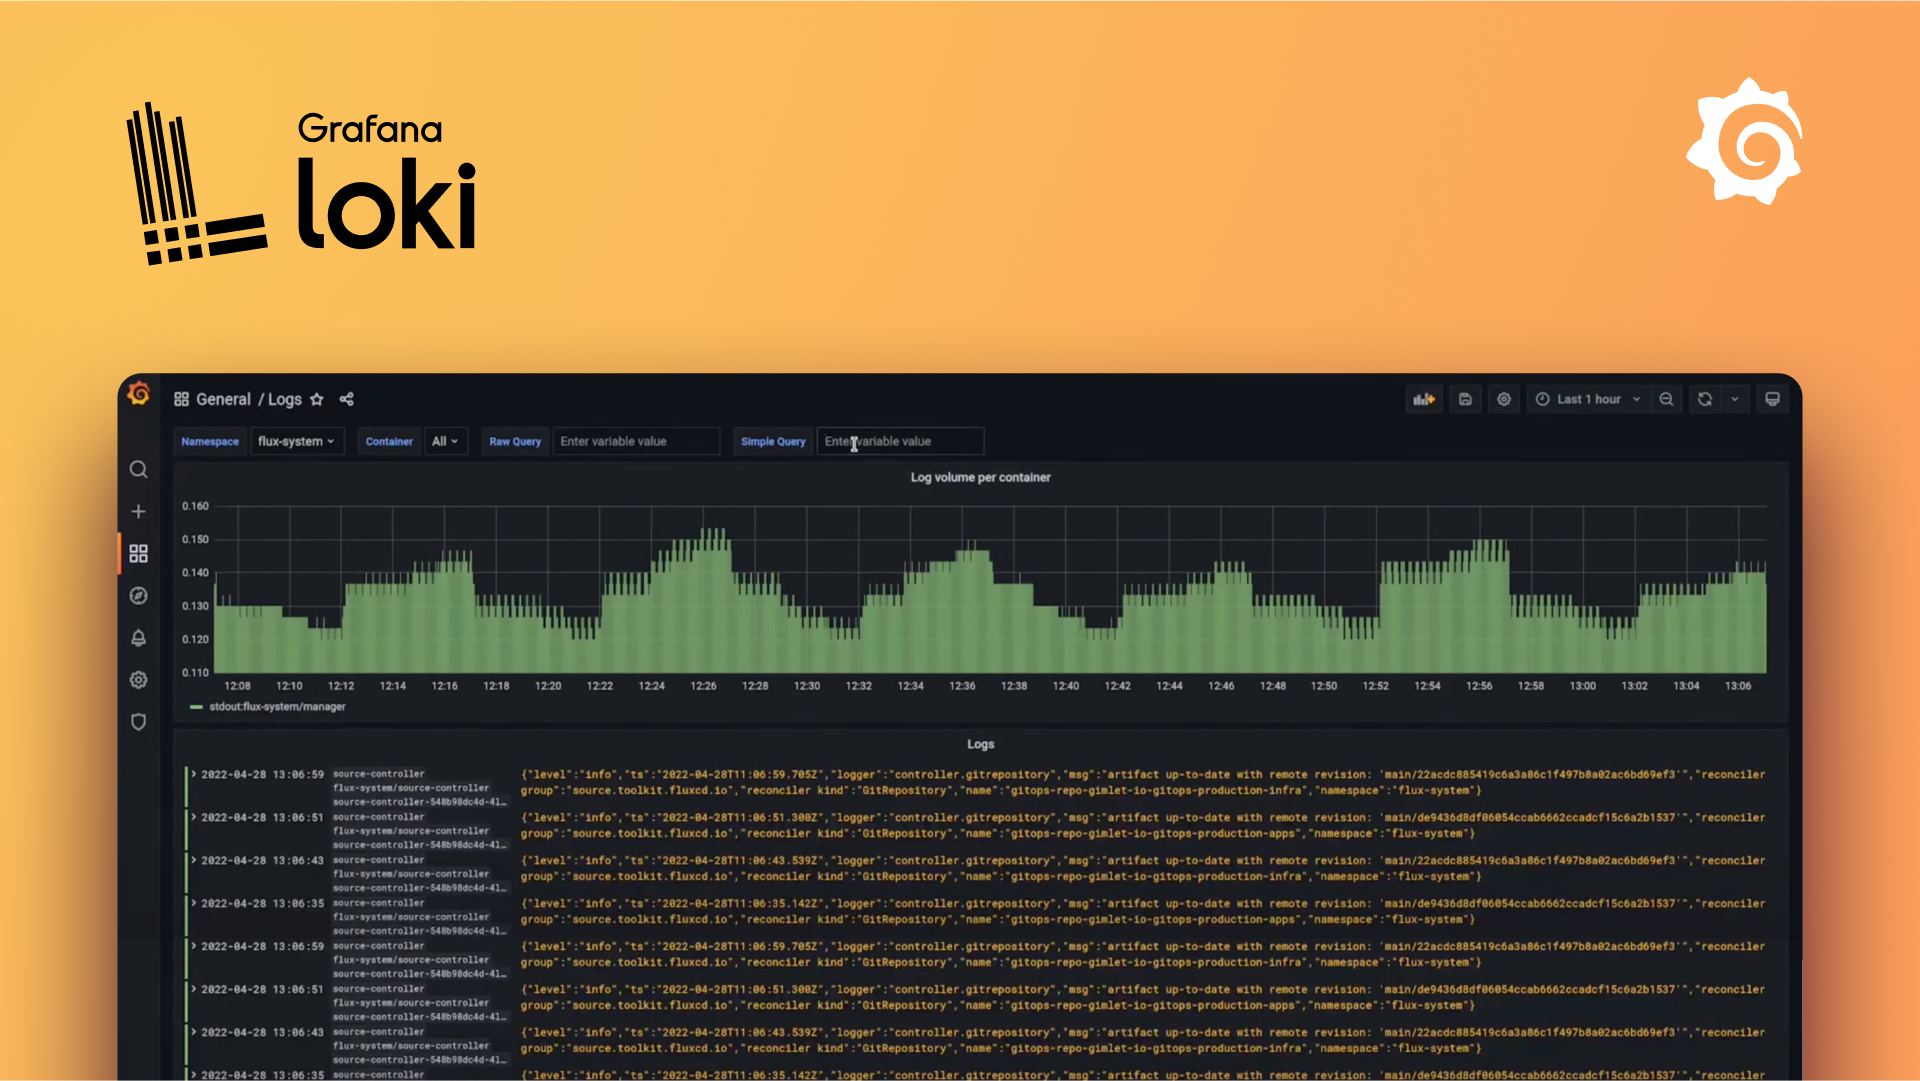
Qbox Logging gives your FiveM server its own Grafana and Loki environment on a dedicated virtualized machine. Instead of sharing a restricted logging platform or fighting with limited hosted tiers, you get a setup you actually control, built for serious monitoring, debugging, investigations, and long-term observability.
Good logging is not just a nice extra. It is one of the most important parts of running a well-managed server. When players report abuse, when a resource starts failing, or when staff need to understand exactly what happened during an incident, logs are often the difference between guessing and knowing. A strong logging setup helps you catch exploit patterns faster, investigate suspicious behavior with confidence, and understand what is happening on your own server at all times.
Who is this for?
This is for server owners and development teams who want the power of Grafana and Loki without having to build the entire stack from scratch.
It is a strong fit if you want to:
- Centralize FiveM server logs in a proper observability stack
- Give staff better tools for investigations, moderation, and anti-cheat review
- Build dashboards for gameplay, economy, jobs, player actions, or resource health
- Move beyond limited shared logging platforms and get full control over your own environment
- Use Loki and Grafana in a way that can grow with your server instead of being boxed into a fixed hosted plan
What do I get?
Each customer gets their own virtualized machine with their own Grafana and Loki instances. That means you are not just getting access to a shared dashboard. You are getting your own environment with real control.
That includes:
- Full access to your own Grafana instance
- Your own Loki instance for storing and querying logs
- The ability to create as many dashboards as you need
- Support for adding more data sources and building richer observability workflows
- Team access so you can invite staff and control who can view or manage dashboards
- Direct access to the Grafana and Loki tooling you need for serious server operations
By default, log retention is set to 90 days.
You can change retention settings yourself, but this is intended for advanced users only. Editing Loki retention without understanding the storage and performance impact can lead to unnecessary disk usage or broken expectations around how long logs are kept.
What can I do with it?
With your own Grafana and Loki environment, you can do far more than just read raw logs.
Common use cases include:
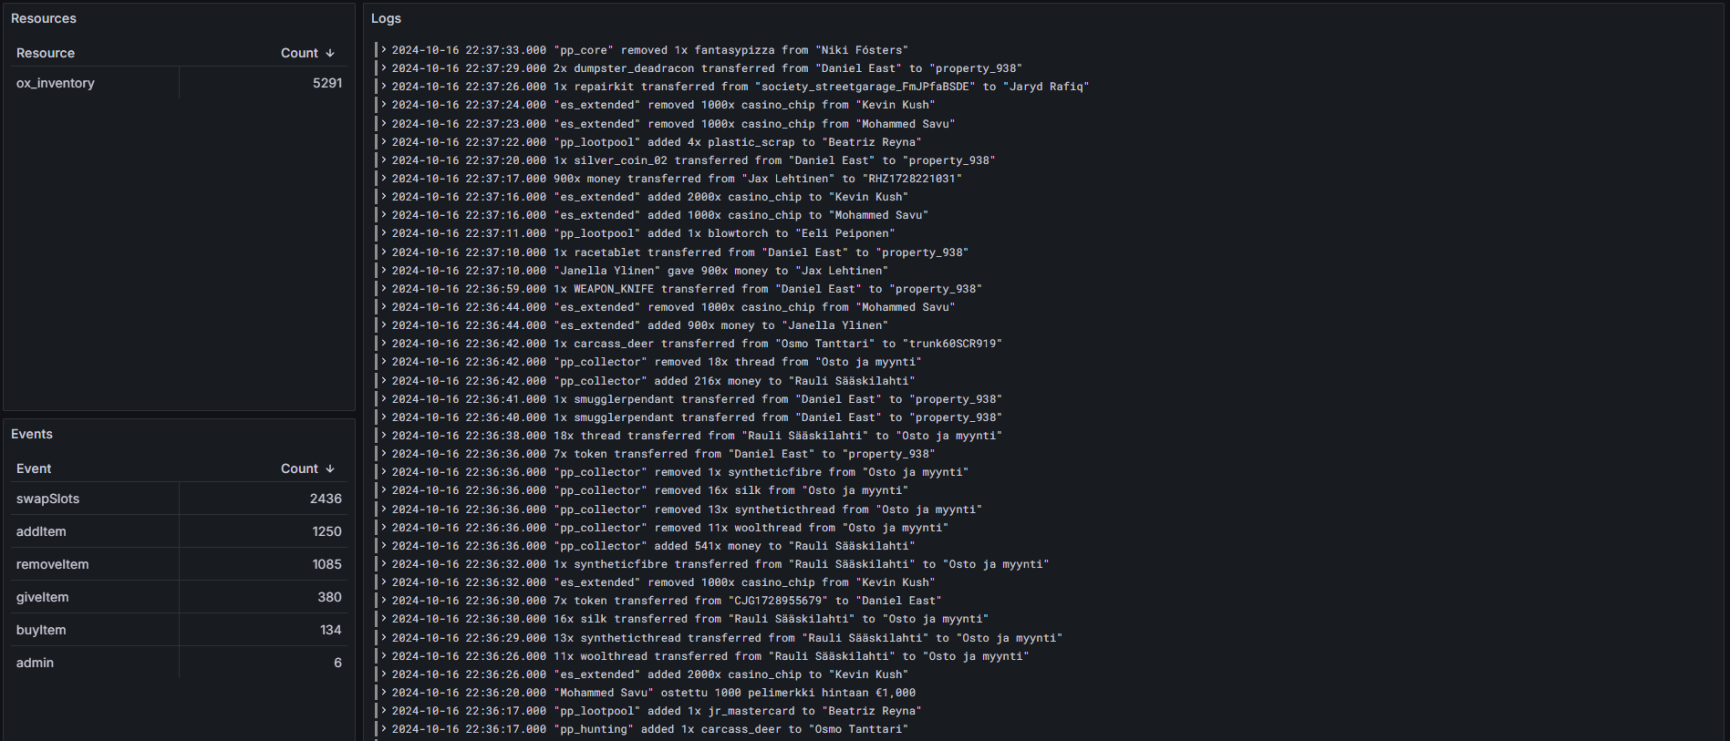
- Investigating player reports and suspicious activity with searchable structured logs
- Tracking resource errors, warnings, and server-side events over time
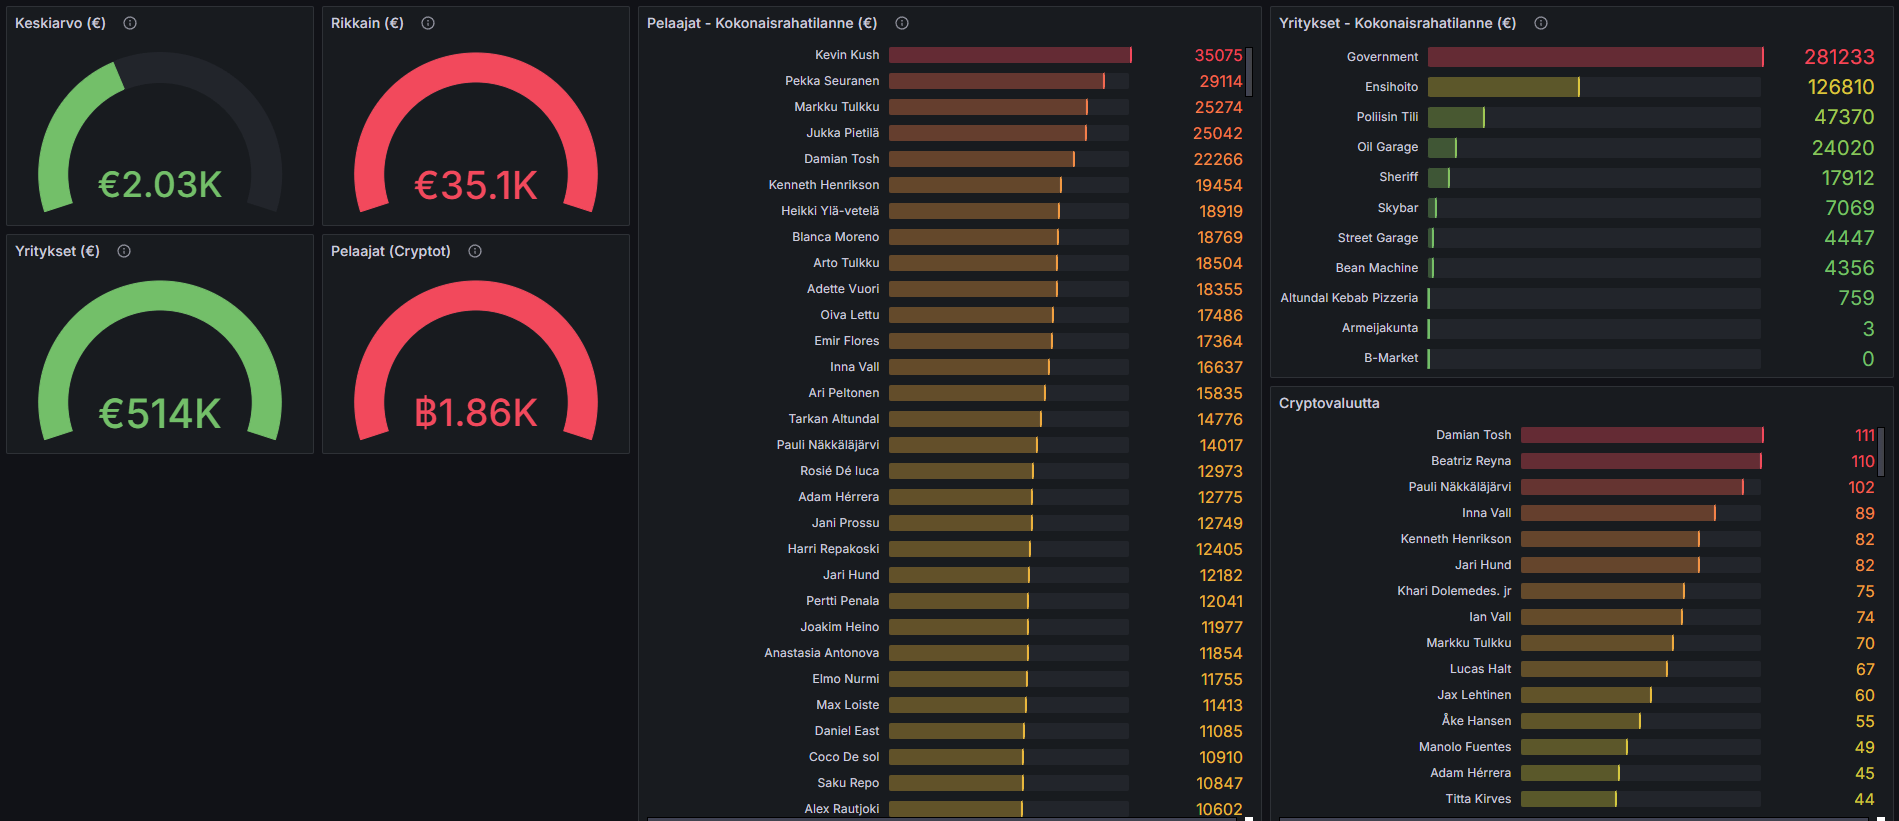
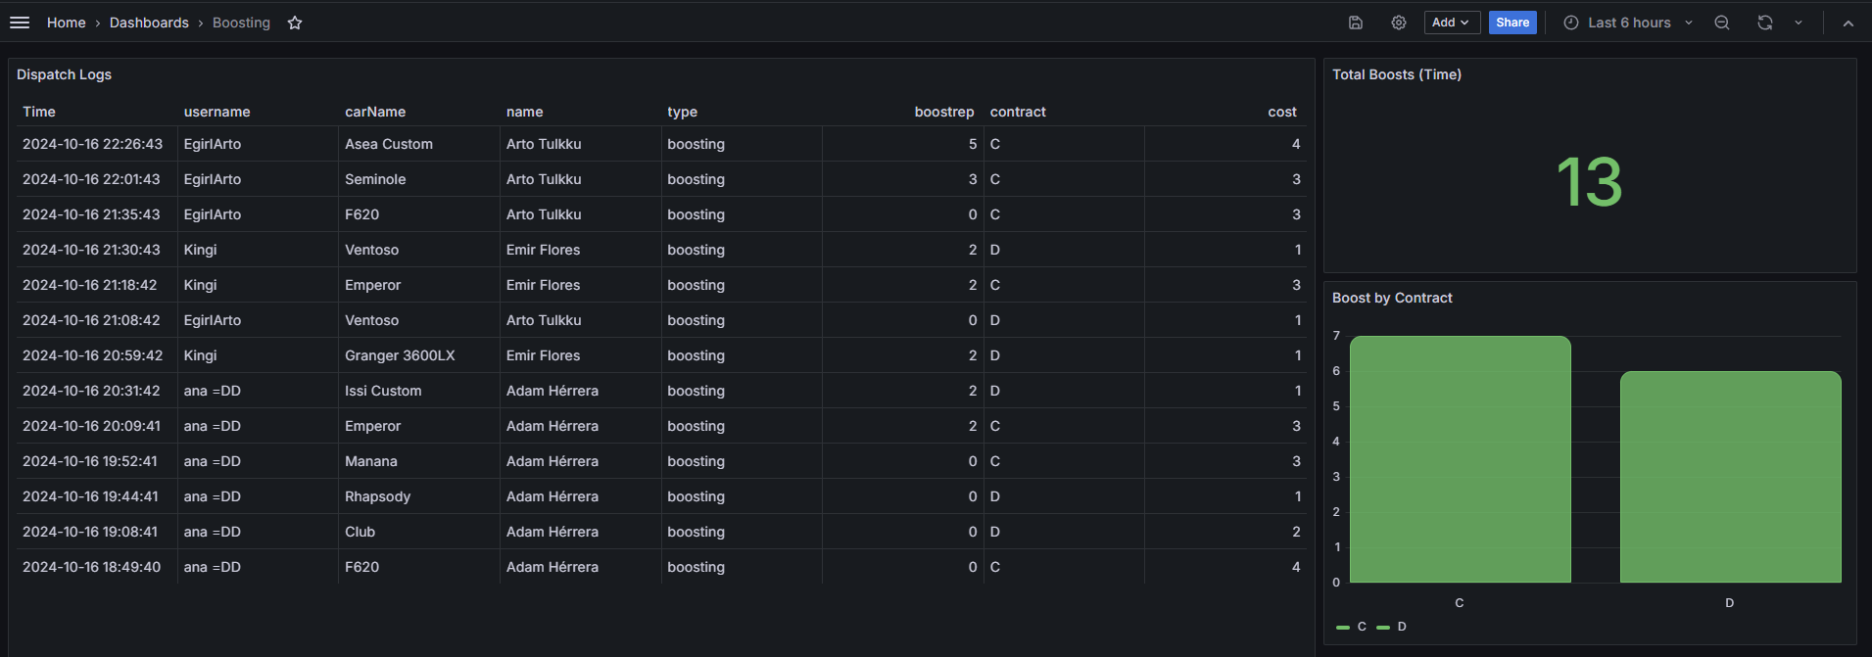
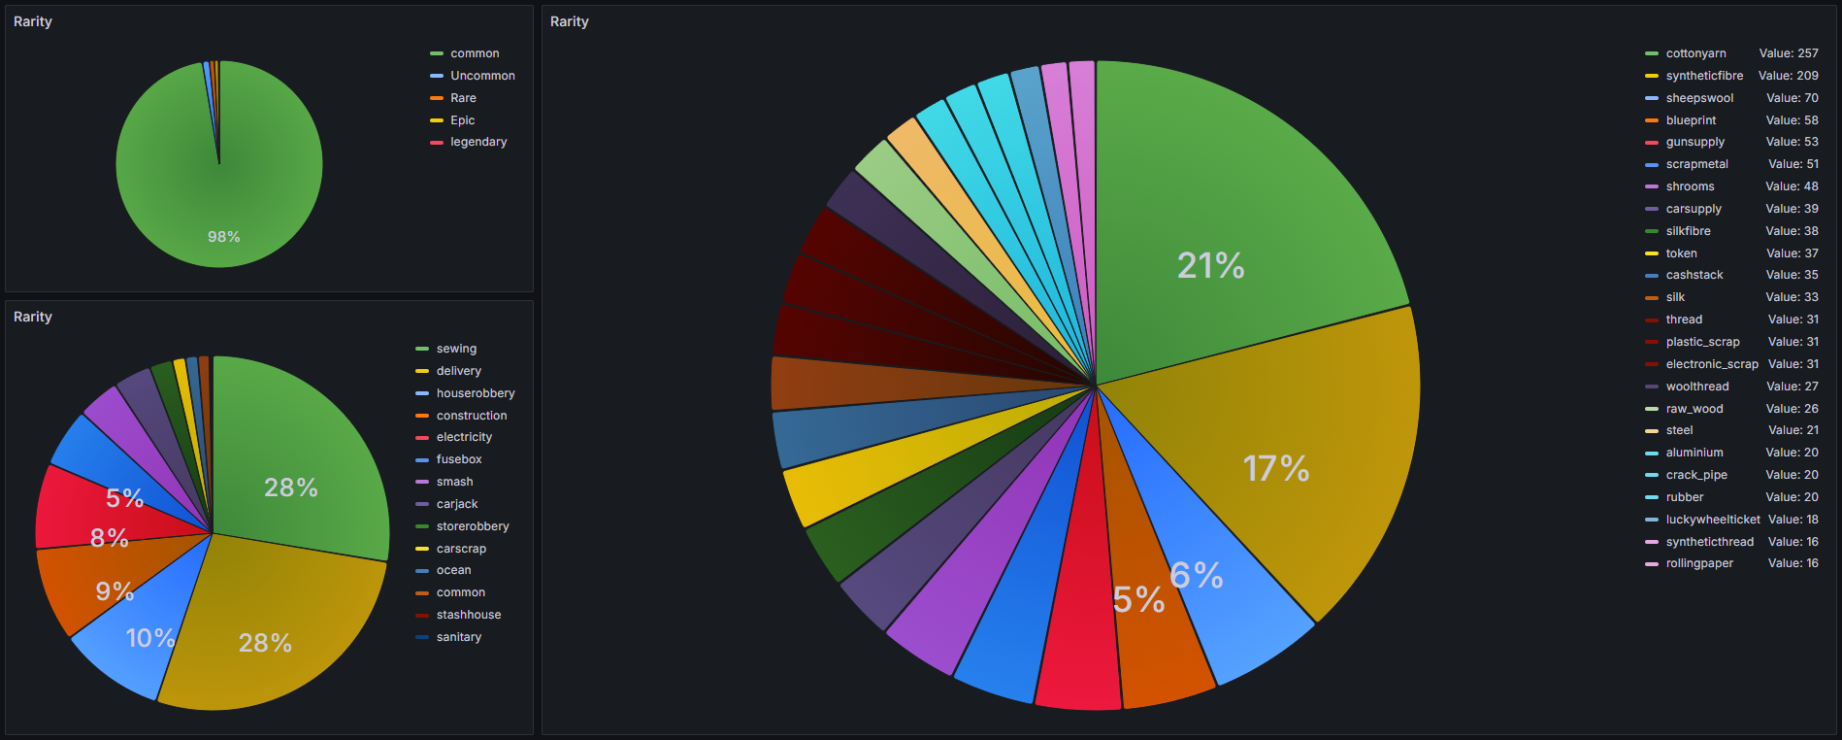
- Building dashboards for staff activity, economy patterns, or gameplay systems
- Correlating logs with database-backed dashboards for deeper operational insight
- Creating panels and views that help your team spot issues before they become bigger problems
Here are a few examples of what is possible when Grafana, Loki, and your database are working together.
Why this matters
As your server grows, reactive administration stops scaling. You cannot rely on memory, screenshots, or scattered console output when you need to understand what happened. A proper logging stack gives your staff a source of truth.
That is the real value here: faster investigations, better visibility, and infrastructure that you control. Instead of being limited by a shared hosted product, you get an environment that can be shaped around your own server, your own team, and your own workflows.
Getting started
Once your access is provisioned, you can sign in and begin using your Grafana and Loki environment right away. From there, you can connect your server logs, invite staff, build dashboards, and start tailoring the stack to your needs.
If you are new to Grafana, it is still worth spending a bit of time with the official documentation so you understand how dashboards, data sources, and queries fit together.